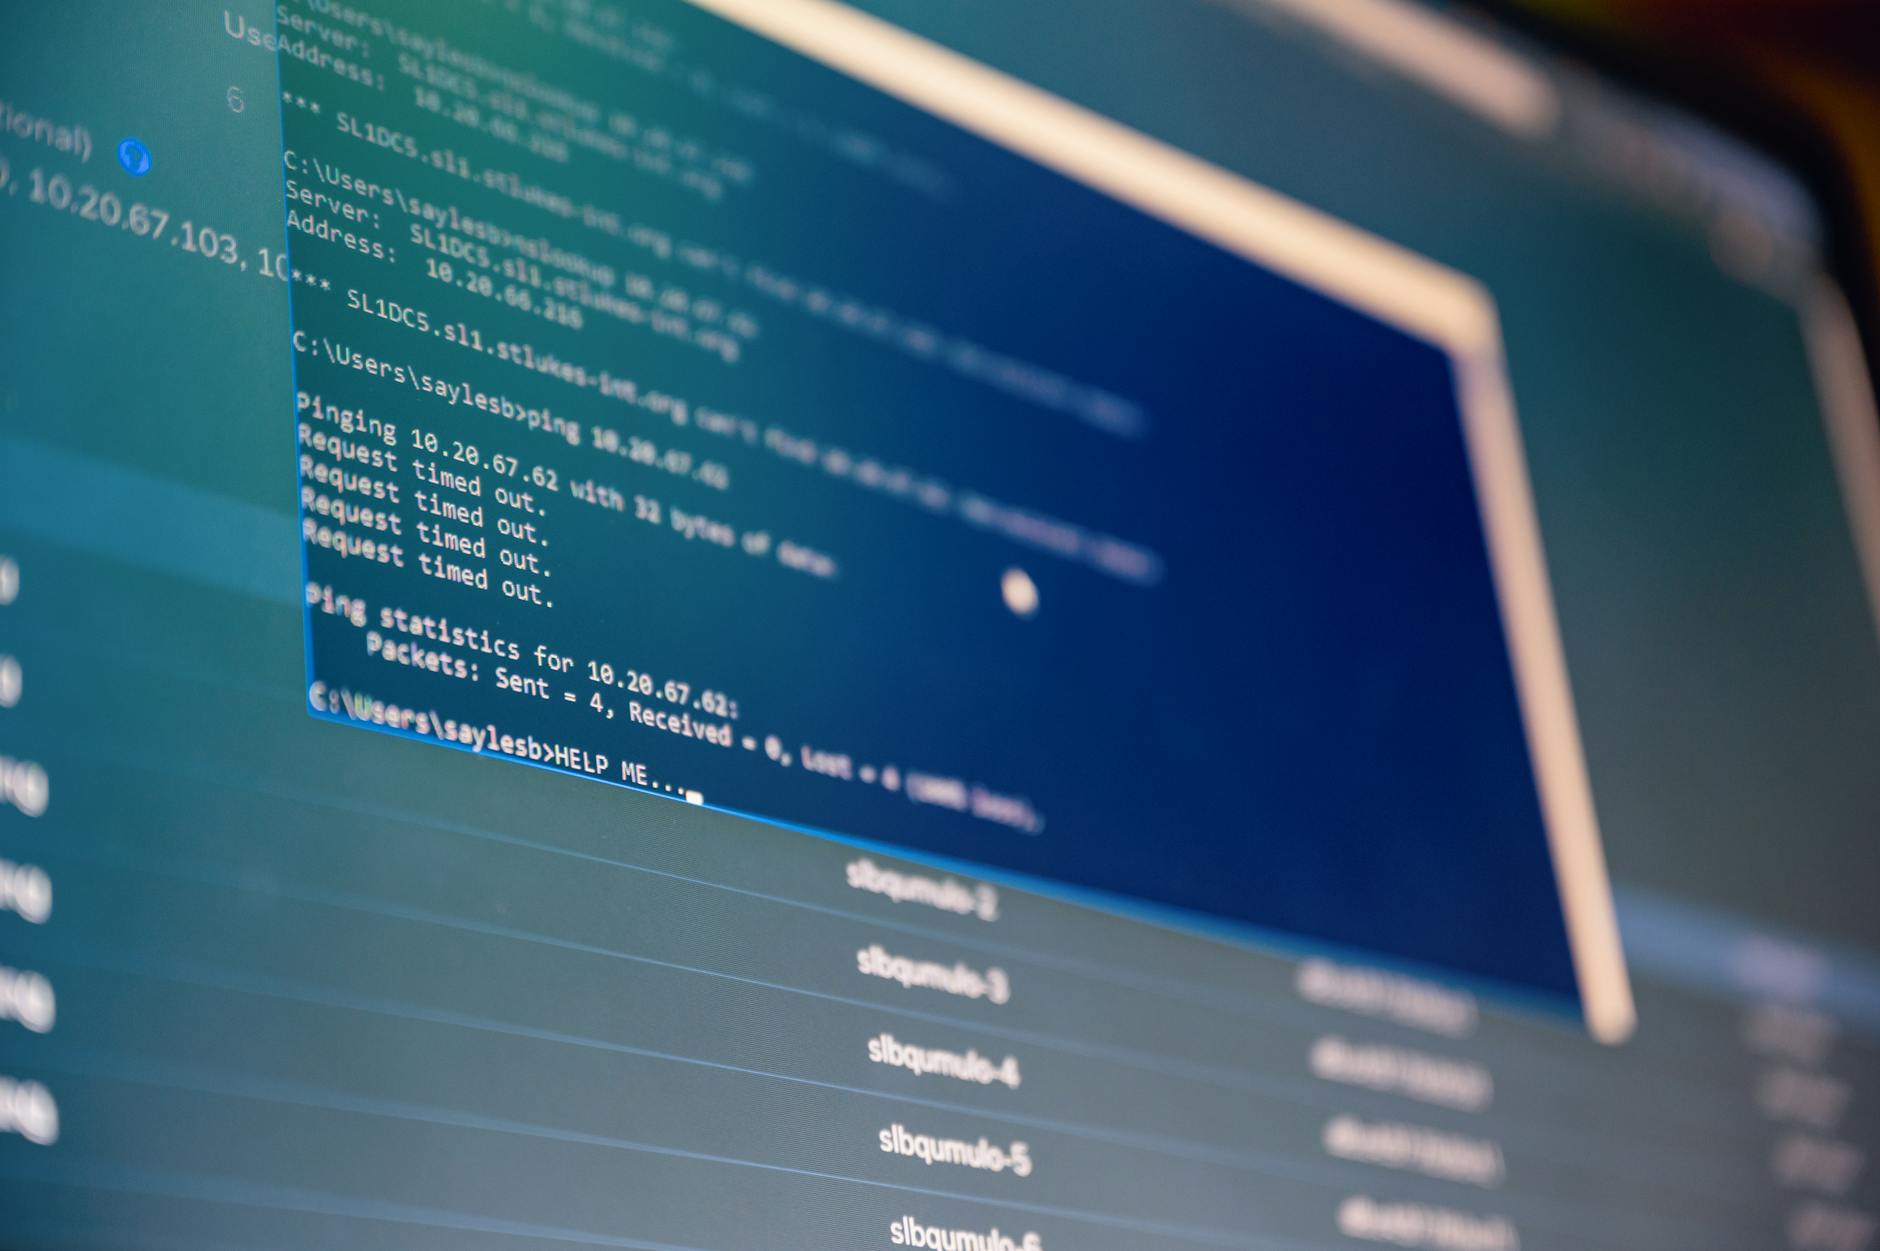
How to Use tcpdump for Network Troubleshooting
Network troubleshooting often requires deep visibility into packet-level communication. The tcpdump utility stands as one of the most powerful command-line tools for capturing and analyzing network traffic on Linux and Unix systems. Whether you’re diagnosing connectivity issues, investigating security incidents, or optimizing network performance, mastering tcpdump is essential for any IT professional.
Table of Contents
- What is tcpdump?
- Installing tcpdump
- Basic tcpdump Commands
- Filtering Traffic Effectively
- Saving and Analyzing Captures
- Advanced Troubleshooting Techniques
- Common Use Cases
- Best Practices and Security Considerations
What is tcpdump?
tcpdump is a packet analyzer that runs on the command line, allowing administrators to capture and display TCP/IP and other network packets transmitted over a network interface. It provides raw, unfiltered access to network traffic, making it invaluable for diagnosing network problems, security analysis, and protocol debugging.
Unlike graphical tools like Wireshark, tcpdump operates entirely from the terminal, making it perfect for remote server troubleshooting via SSH. It’s lightweight, fast, and available on virtually every Unix-like operating system, including Linux, BSD, and macOS.
Installing tcpdump
Most Linux distributions include tcpdump in their default repositories. Here’s how to install it on common systems:
Ubuntu and Debian
sudo apt update
sudo apt install tcpdump
CentOS and RHEL
sudo yum install tcpdumpFedora
sudo dnf install tcpdumpAfter installation, verify tcpdump is working by checking its version:
tcpdump --versionNote that tcpdump requires root privileges to capture packets, so you’ll need to run it with sudo or as the root user.
Basic tcpdump Commands
Capturing All Traffic
The simplest tcpdump command captures all packets on the default network interface:
sudo tcpdumpThis produces a continuous stream of packet information until you stop it with Ctrl+C. However, this output can be overwhelming on busy networks.
Specifying Network Interfaces
To capture traffic on a specific interface, use the -i flag:
sudo tcpdump -i eth0To list available interfaces:
tcpdump -DLimiting Packet Count
Capture only a specific number of packets using the -c option:
sudo tcpdump -c 100This captures exactly 100 packets and then stops automatically.
Verbose Output
Increase verbosity with -v, -vv, or -vvv for progressively more detailed information:
sudo tcpdump -vFiltering Traffic Effectively
The real power of tcpdump lies in its filtering capabilities. Proper filtering helps you focus on relevant traffic and reduces noise.
Host-Based Filtering
Capture traffic to or from a specific host:
sudo tcpdump host 192.168.1.100To filter only source or destination traffic:
sudo tcpdump src host 192.168.1.100
sudo tcpdump dst host 192.168.1.100
Port-Based Filtering
Monitor specific ports, useful for troubleshooting particular services:
sudo tcpdump port 80
sudo tcpdump port 443
Combine source and destination ports:
sudo tcpdump src port 1025
sudo tcpdump dst port 22
Protocol Filtering
Filter by protocol to isolate specific types of traffic:
sudo tcpdump icmp
sudo tcpdump tcp
sudo tcpdump udp
Complex Filters
Combine filters using logical operators (and, or, not):
sudo tcpdump host 192.168.1.100 and port 80
sudo tcpdump src host 192.168.1.100 and not dst port 22
sudo tcpdump 'tcp port 80 or tcp port 443'
When deploying network monitoring in cloud environments like Kamatera, understanding how to filter traffic becomes especially important for managing bandwidth and identifying performance bottlenecks across distributed infrastructure.
Saving and Analyzing Captures
Writing to Files
Save captured packets to a file for later analysis:
sudo tcpdump -w capture.pcapThe .pcap format is standard and can be opened with Wireshark and other analysis tools.
Reading from Files
Analyze previously captured files:
tcpdump -r capture.pcapApply filters when reading:
tcpdump -r capture.pcap port 80Rotating Capture Files
For long-term captures, rotate files automatically:
sudo tcpdump -w capture.pcap -C 100 -W 5This creates files up to 100MB each, keeping only the last 5 files.
Advanced Troubleshooting Techniques
Displaying ASCII Content
View packet content in ASCII format:
sudo tcpdump -AOr in both hex and ASCII:
sudo tcpdump -XTimestamp Options
Add detailed timestamps for precise timing analysis:
sudo tcpdump -ttttTroubleshooting DNS Issues
Capture DNS queries and responses:
sudo tcpdump -i any -s0 port 53Analyzing HTTP Traffic
Capture HTTP requests with headers:
sudo tcpdump -A -s0 'tcp port 80 and (((ip[2:2] - ((ip[0]&0xf)<<2)) - ((tcp[12]&0xf0)>>2)) != 0)'When troubleshooting encrypted traffic, especially when using services like NordVPN, remember that tcpdump will only show encrypted packets. You’ll need to capture traffic before encryption or use appropriate decryption tools.
Detecting Network Scans
Identify SYN scans or port scanning attempts:
sudo tcpdump 'tcp[tcpflags] & (tcp-syn) != 0 and tcp[tcpflags] & (tcp-ack) = 0'Common Use Cases
Connectivity Testing
When troubleshooting connectivity issues, capture ICMP traffic to verify ping responses:
sudo tcpdump -i any icmpApplication Performance
Identify slow database queries by monitoring specific application ports:
sudo tcpdump -i any port 3306 -w mysql_traffic.pcapSecurity Investigation
During security incidents, capture all traffic from suspicious hosts:
sudo tcpdump -i any host 10.0.0.50 -w suspicious_activity.pcapNetwork Baseline
Establish network baselines by capturing traffic patterns during normal operations:
sudo tcpdump -i eth0 -w baseline.pcap -G 3600 -W 24This captures one hour segments for 24 hours.
Best Practices and Security Considerations
Minimize Privacy Impact
Be mindful that tcpdump captures all data, including potentially sensitive information. Always:
- Get proper authorization before capturing traffic
- Secure capture files with appropriate permissions
- Delete captures after analysis
- Follow organizational policies and legal requirements
Resource Management
Long captures can consume significant disk space. Use these practices:
- Implement file rotation with -C and -W options
- Use filters to capture only relevant traffic
- Monitor disk usage during long captures
- Consider snapshot length with -s to limit captured bytes per packet
Performance Considerations
Running tcpdump on production systems can impact performance:
- Use specific filters to reduce processing overhead
- Avoid verbose output on high-traffic interfaces
- Consider using buffer options (-B) on busy networks
- Test performance impact in non-production environments first
Documentation
Always document your troubleshooting sessions:
- Record the exact tcpdump commands used
- Note timestamps and conditions
- Document findings and resolutions
- Maintain a knowledge base of useful filters
Conclusion
Mastering tcpdump for network troubleshooting gives you unparalleled visibility into network behavior. From basic packet captures to complex filtering and analysis, tcpdump remains an essential tool in every network administrator’s toolkit. By practicing the commands and techniques outlined in this guide, you’ll develop the skills needed to quickly diagnose and resolve network issues.
Start with simple captures and gradually incorporate more advanced filters as you become comfortable with the tool. Remember that effective troubleshooting combines tcpdump’s raw packet data with knowledge of networking protocols and application behavior. With experience, you’ll develop intuition for which filters and techniques work best for specific troubleshooting scenarios.
Follow Networkyy
Join 125,000+ IT professionals: